
Methodology
Sampling
BRFSS data are collected through telephone interviews using random-digit-dialing (RDD). Telephone numbers are sampled using a stratified sampling (DSS) design. Alaska’s
seven public health regions are used to define each stratum with some exceptions and variations from year to year. A dual sampling frame methodology, incorporating both landline and cellular telephones, has been implemented by the CDC since 2011. Only landline telephones were included before this time. Prevalence estimates from 2011 and later should not be compared to estimates before 2011. A
summary of BRFSS methodologic changes in 2011 and potential effects on estimates are available.
Telephone numbers are selected from blocks of potential phone numbers in an area, including unlisted numbers. Separate lists of landline and cell phone numbers are used. Calls are made seven days a week during both the daytime and the evening. For each landline household contacted, one adult is randomly selected for interviewing from all adults living in the household. Cellular telephone participants are considered primary users of their phone numbers and interviewed directly. Participants are chosen at random to ensure that the data collected is generalizable to the state as a whole.
Sample Size
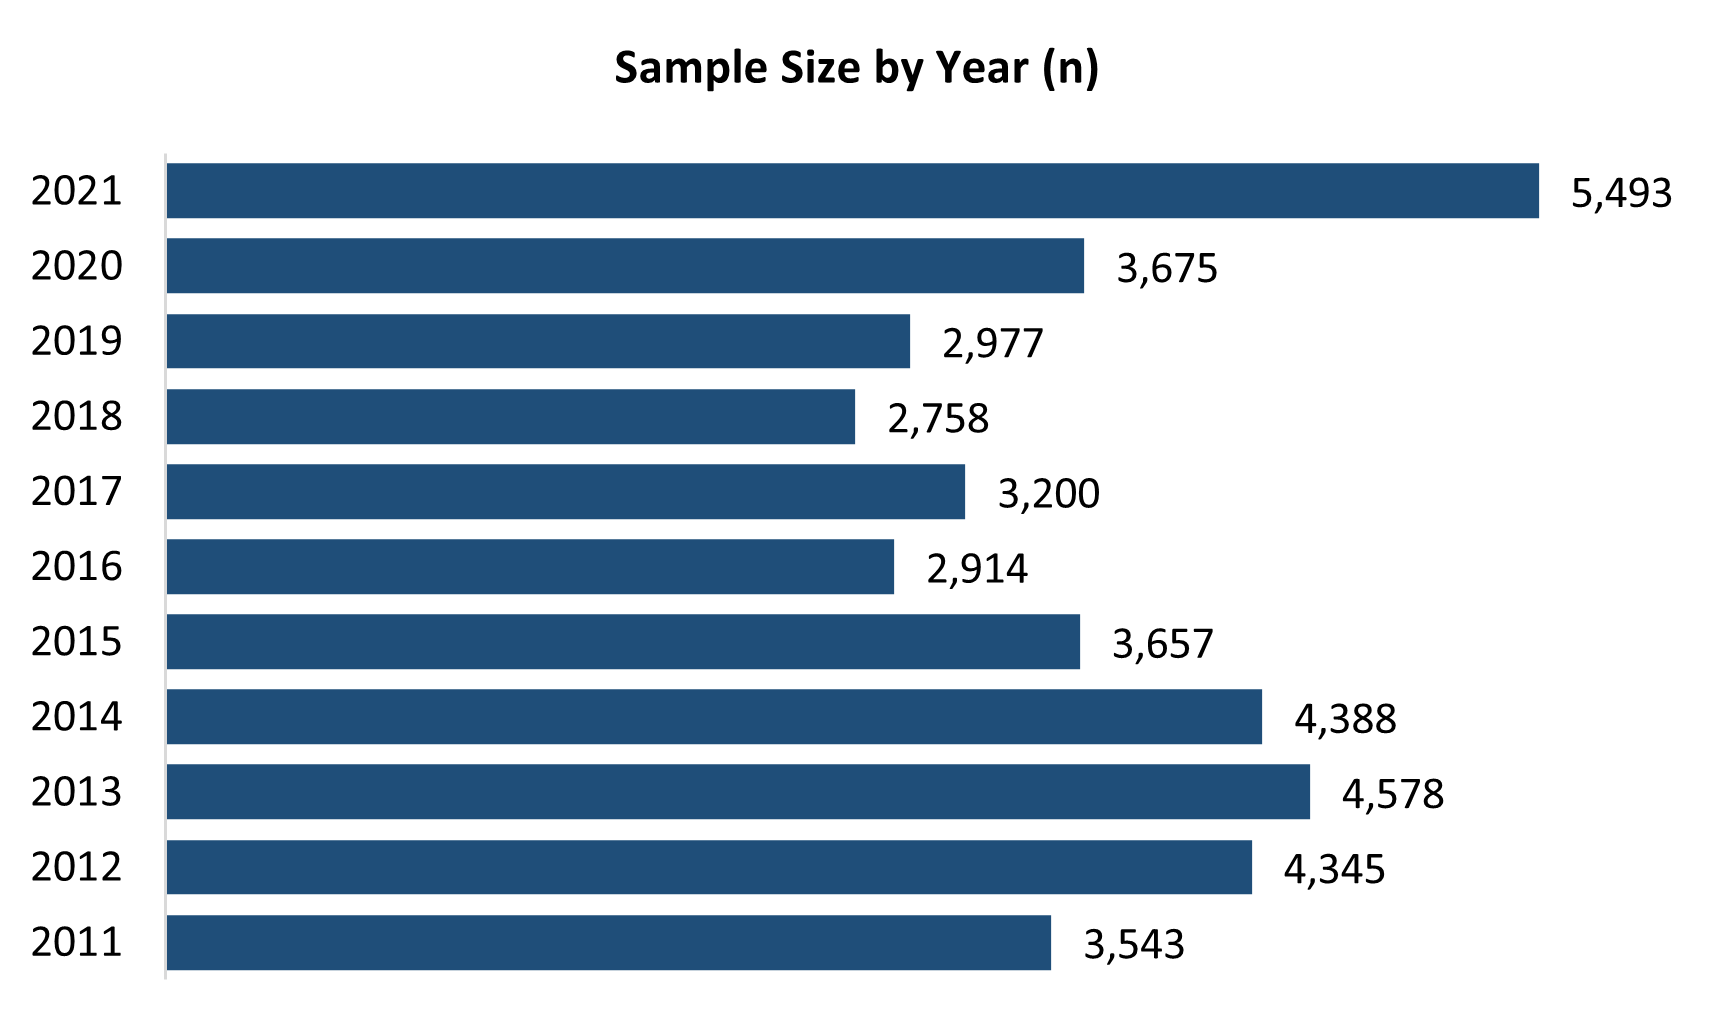
The number of completed interviews in Alaska varies each year, and largely depends upon the available budget. Since 2011, the CDC requires a minimum of 2,500 interviews to generate reliable state-level estimates for inclusion into the national dataset.
Data Collection
Alaska contracts with ICF Macro, Inc. to collect BRFSS data. Approximately the same number of interviews are collected each month throughout the calendar year to reduce bias caused by seasonal variation in health behaviors and conditions. Like most states, ICF uses a computer-assisted telephone interviewing (CATI) software program where the questionnaire is displayed on a computer screen during each telephone interview, and the interviewer enters the responses directly into a computer. CATI software programs are used for the following reasons:
- Data entry errors are minimized.
- Questions not applicable to the current respondent (for example, age- or sex-specific questions) are automatically skipped.
- Responses can be automatically checked, and those that are found unacceptable (such as impossible body weight) are immediately brought to the interviewer's attention so that they can be corrected.
BRFSS interviews are “scripted” to obtain consistent results. The interviewers are trained and instructed to read the questions in specific ways. However, this can sometimes make the flow of the interview sound unnatural to the person being interviewed.
Data Weighting
Data weighting is an important statistical process that accounts for the differences between survey respondents and the population that the data should represent. Data may not include all population groups proportionately due to sample design, random chance, and other factors. For example, people with multiple phones are more likely to be called and some demographic groups may be less likely to respond to telephone surveys.
Since 2011, the CDC has used a method called iterative proportional fitting or “raking” to weight data. Raking adjusts the data so that under-represented groups can be accurately represented in the final dataset. Age, sex, categories of race and ethnicity, marital status, education level, home ownership, type of phone ownership, and geographic regions are currently used to weight BRFSS data to represent the true population of adults in Alaska. Compared to post stratification weighting, which was used prior to 2011, the use of raking has been shown to reduce error within estimates. Prevalence estimates from 2011 and later should not be compared to estimates before 2011.
Using the same weighting methods as the CDC, Alaska re-weights annual data using population estimates from the
Alaska Department of Labor and Workforce Development. Starting in 2020, data is weighted by smaller
behavioral health system regions when the sample size is sufficient.
Public health regions were used for weighting prior to 2020 with some exceptions and variations from year to year. Prevalence estimates generated using Alaska weights may differ somewhat from those generated using CDC weights. Please email
brfss@alaska.gov if you are interested in obtaining more information about Alaska or CDC weighting methods.
Data Limitations
There are certain limitations associated with BRFSS data and various ways that error can be introduced into the data. BRFSS data are used to generate prevalence estimates. These are estimates of the true incidence of a particular condition or behavior in the population because they are based on a sample of the population, not the whole population. The reliability of each estimate is directly related to the number of survey respondents in the population sample.
BRFSS relies on information reported directly by respondents, so it may be subject to sources of error. How questions are worded may elicit responses in a certain way and can result in what is called "measurement error.” Similarly, the ability to accurately recall details varies by person and how much time has passed since the event they are trying to recall, which leads to "recall bias". Some BRFSS questions are on sensitive topics and respondents may alter their answer to present a favorable impression to the interviewer or to avoid stigma. This is called “social desirability bias”. It is also possible that the people who choose to participate are different than those who do not. Interviews are only conducted in English in Alaska, so adults who are not able to be interviewed in English are not included. Households without telephones are not contacted. Thus, BRFSS findings can only be generalized to English speaking adults living in households with telephones. This is called “selection bias”.
There is no reason to believe that these sources of bias change significantly from year to year. This means that even if the results are not precise, they can be compared over time. This allows us to determine if the prevalence of a given condition or behavior is increasing or decreasing.
Data Analysis
Weighted data analysis is conducted using complex survey procedures to estimate the prevalence of risk factors, health conditions and behaviors among adults 18 years and older in Alaska. Data analysis is primarily conducted by the Alaska BRFSS team, but
data sets are available upon request to researchers with experience analyzing complex survey data.
Data quality and suppression
The relative standard error (RSE), also known as the coefficient of variation (CV), is an index of how reliable (variable) the estimate is. The RSE is expressed as a percentage of how much variability there is relative to the estimate itself (i.e., the standard error of the estimate divided by the estimate itself). A higher RSE generally indicates a more variable and less precise estimate. Small sample sizes often contribute to unstable estimates.
Alaska includes data quality flags to indicate when a result is statistically unstable, meaning we have a lower level of confidence in the result as an estimate of the true percentage in the Alaska adult population. CDC considers an RSE of greater than 30% to be unstable. Alaska flags prevalence estimates as unstable when the RSE is greater than 30% up to 50%.
To protect participant anonymity and ensure high data quality, Alaska does not report estimates that are based on a small number of responses or are highly statistically unreliable. We use two standards to decide when it is necessary to suppress a result. When either or both of the following criteria are met, the prevalence estimate for an indicator is not reported.
- 1. Any unweighted count in the denominator that is less than 50 respondents.
- 2. The relative standard error (RSE) is greater than 50%.
Combining two or more years of survey data or expanding the geographic boundary are two ways to increase the stability of an estimate. Both strategies increase the number of responses in the numerator and denominator and reduce the need for flagging or suppression.
Confidence intervals
Alaska generates 95% logit confidence limits assuming complex sampling with replacement. Confidence intervals provide a measure of how much an estimate might vary due to chance. If Alaska BRFSS conducted this survey 100 times, approximately 95 of the 100 confidence intervals calculated would contain the true population value. A good way to think about the 95% confidence interval is that it provides a range of plausible values for the condition or behavior and gives us a sense of the precision of the estimate.
